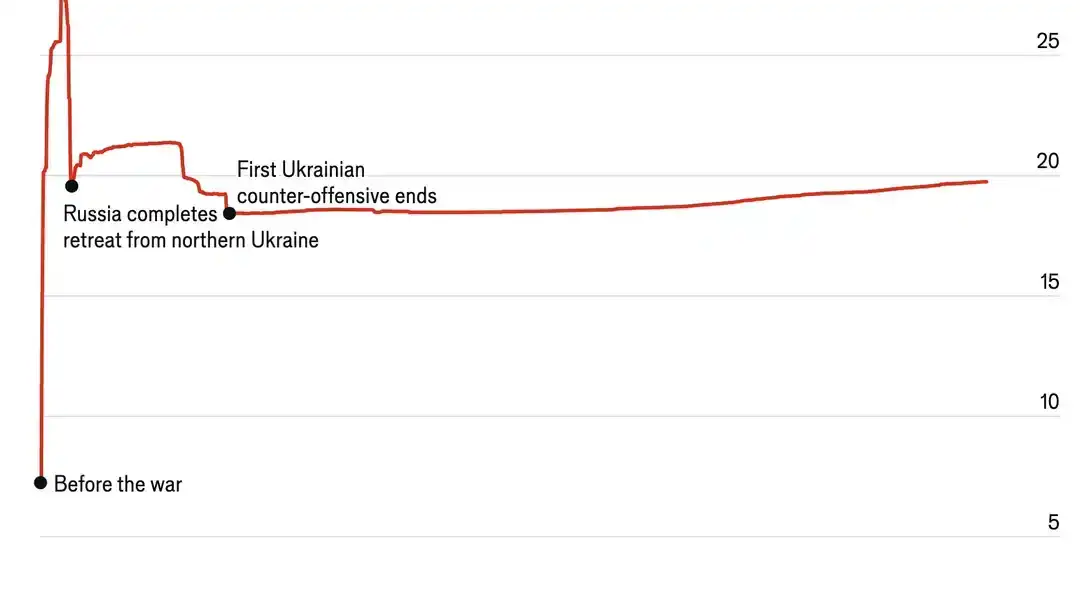
The axis does start at 0. The graph does show slow advance on part of Russia, but also shows no advance on part of Ukraine since 2022.
The graph shows about 20% of the country in currently occupied, which is 1/5th and it is not a negligible amount.
This graph depicts the war objective of Ukraine, which is freeing all its occupied territories. Progress over that objective has not been achieved in a long while.
The graph does not depict the Russian war objective (at least the declared one) of conquering Donetsk and Luhansk. Providing a graph of that may be more informative regarding the war progresses of Russia.
It would also be important to judge whether amount of occupied territory is actually significant in this war. I don’t think it matters too much, as it is not parameter that will make Ukraine stop fighting unless Russia conquers the totality of it. But Russia does not appear to be going for full occupation, nor to be able to do it.
You could play with many other parameters that seem more important for this war: industrial capacity, arms reserves, man reserves, etc.
These graphs are anyway just part of the story and can be interpreted in many ways.
Assuming Ukraine has strong support and with time will be able to repeal attacks -> Russia is too slow in conquering and the war will turn tides at a certain point.
Assuming Russia has strength to keep fighting in these conditions indefinitely -> Russia will slowly but surely conquer the entirety of Ukraine.
Assuming some kind of pact will be made soon -> Russia has strong diplomatic powers as it controls a large part of Ukraine and most of its objectives.


The axis does start at 0. The graph does show slow advance on part of Russia, but also shows no advance on part of Ukraine since 2022. The graph shows about 20% of the country in currently occupied, which is 1/5th and it is not a negligible amount.
This graph depicts the war objective of Ukraine, which is freeing all its occupied territories. Progress over that objective has not been achieved in a long while. The graph does not depict the Russian war objective (at least the declared one) of conquering Donetsk and Luhansk. Providing a graph of that may be more informative regarding the war progresses of Russia.
It would also be important to judge whether amount of occupied territory is actually significant in this war. I don’t think it matters too much, as it is not parameter that will make Ukraine stop fighting unless Russia conquers the totality of it. But Russia does not appear to be going for full occupation, nor to be able to do it. You could play with many other parameters that seem more important for this war: industrial capacity, arms reserves, man reserves, etc.
These graphs are anyway just part of the story and can be interpreted in many ways.
Assuming Ukraine has strong support and with time will be able to repeal attacks -> Russia is too slow in conquering and the war will turn tides at a certain point. Assuming Russia has strength to keep fighting in these conditions indefinitely -> Russia will slowly but surely conquer the entirety of Ukraine. Assuming some kind of pact will be made soon -> Russia has strong diplomatic powers as it controls a large part of Ukraine and most of its objectives.